Drag the line.
See the difference.
Every panel shows the same GPS coordinate — before the Corridor, and after. Pull the handle to reveal what dedicated lanes actually look like.
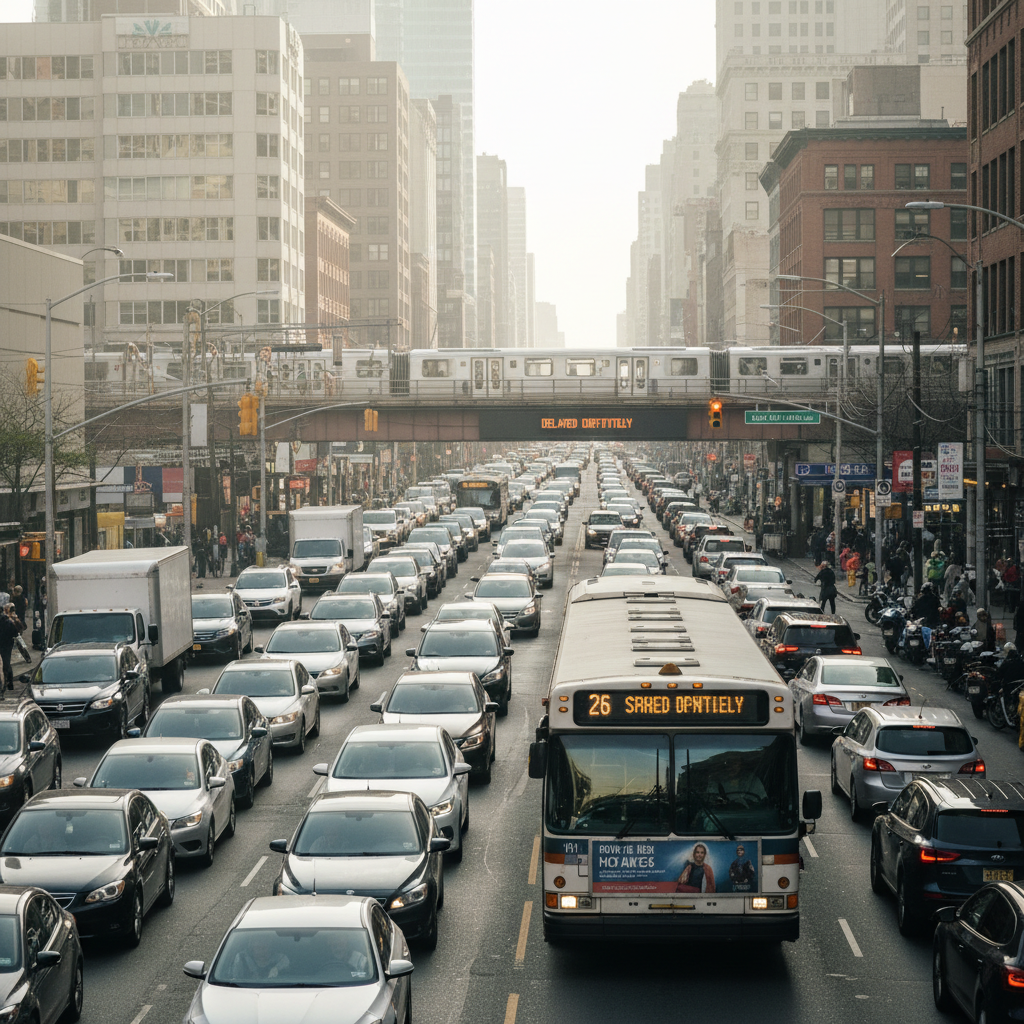
← Drag handle to compare →
The same boulevard.
One transformation.
Today, buses share lanes with 1,200 cars per hour. Signal delays stack. A 3-mile trip takes 45 minutes. The Corridor dedicates the center lane — no turns, no parking, no compromise.
Numbers city planners
can take to a hearing.
Every metric sourced from deployed BRT systems. Not projections — measured outcomes from corridors already running.
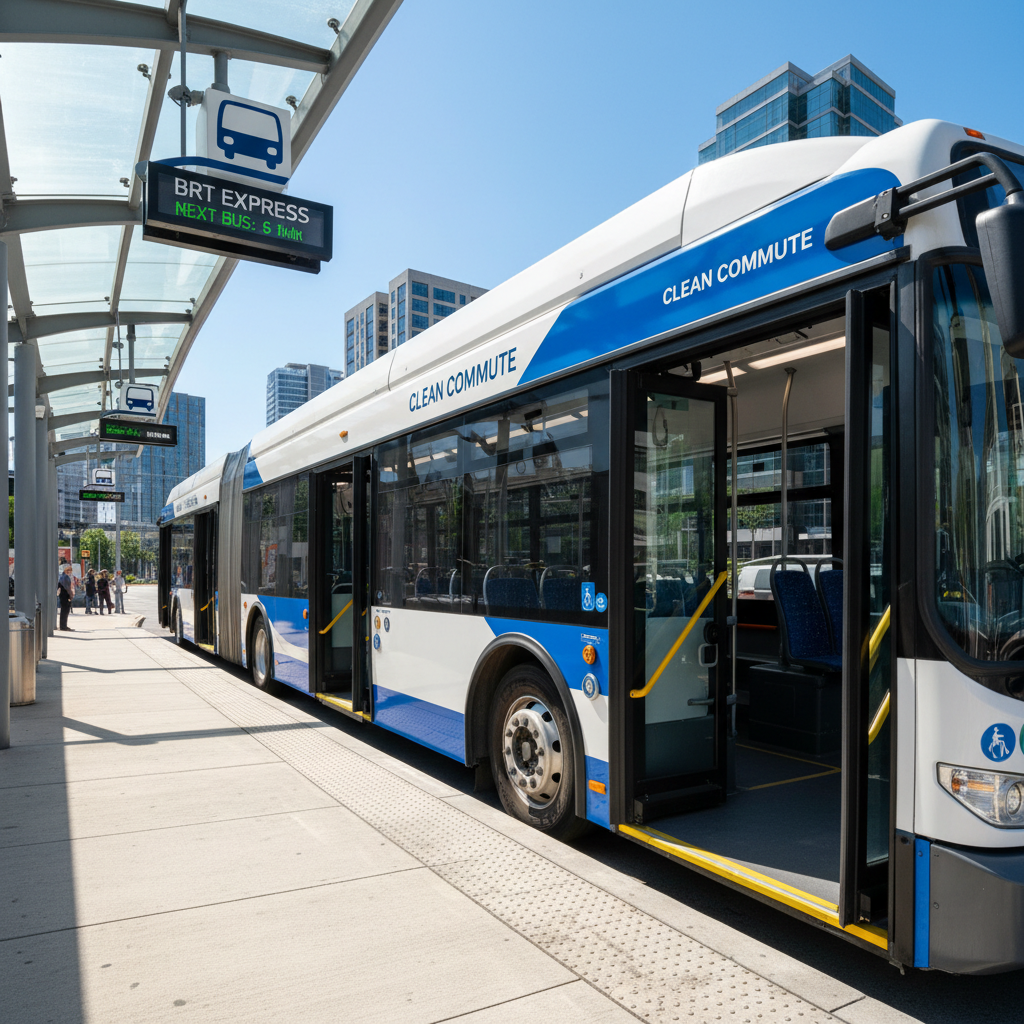
A vehicle designed for the corridor.
New Flyer 60-foot articulated buses — 1.5× the capacity of standard buses, fully electric, with doors on both sides. Boarding from the platform means no steps, no fumbling for fares, no waiting.
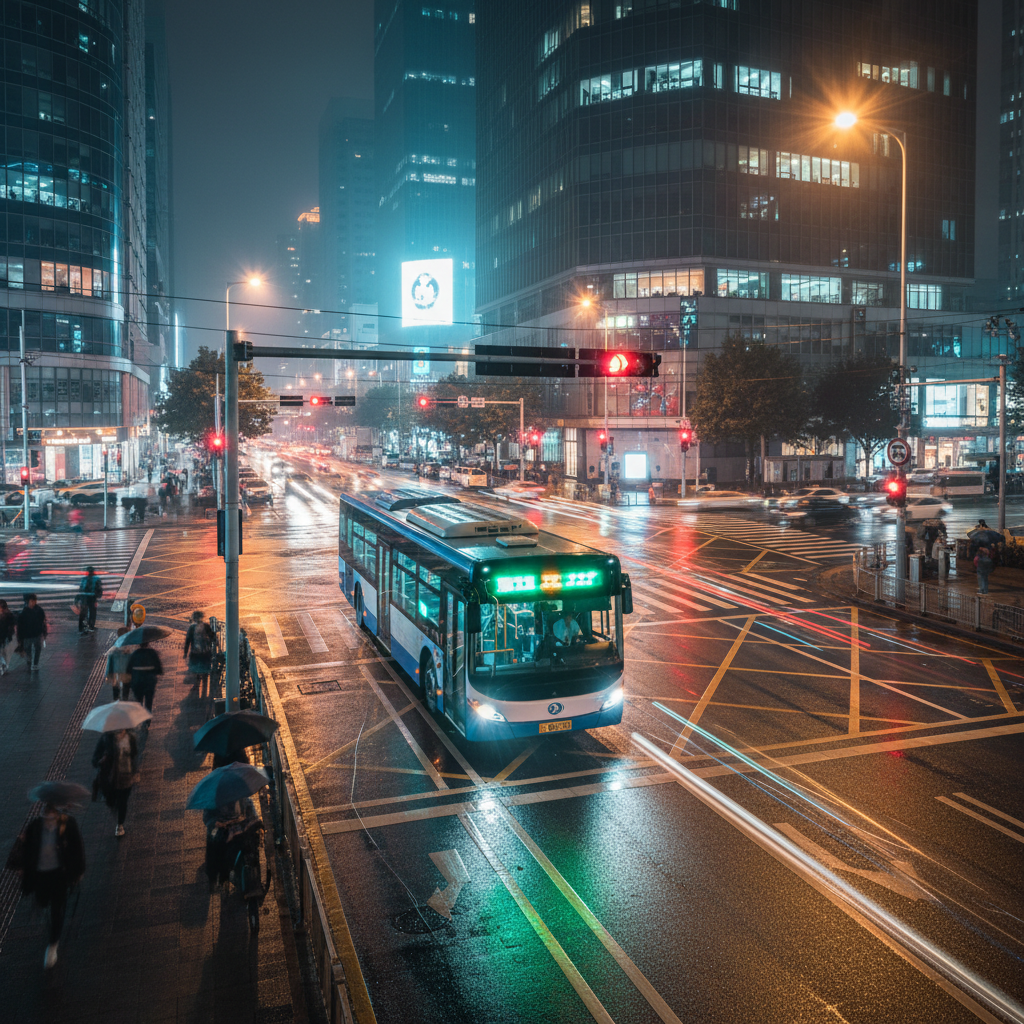
The light changes for the bus.
Transit Signal Priority technology detects approaching vehicles and extends green phases — or shortens red — at every intersection. The bus never stops for a red light it doesn't have to.
One corridor is the start.
165 miles is the plan.
Twelve lines. Every major arterial. All-day frequency. The Twin Cities model proves the network effect — each new corridor multiplies the value of every existing one.